Top 10 Customer Engagement Metrics to Measure in 2025
Customer engagement means developing strong connections with your audience Sales are important, but gaining trust and keeping customers interested in your brand is your priority. Engaged customers are more likely to stick around, buy from you again, and recommend you to others. To understand your progress, it’s essential to monitor the appropriate indicators – or metrics. These metrics show you how well your engagement efforts are working and where you can improve.
In this article, we’ll explore the top 10 metrics for measuring customer engagement that can help you strengthen your connections with your clients.
What is Customer Engagement?
Customer engagement is how frequently customers interact with your brand, the various methods they employ to engage, and the percentage that comes back to buy again.
What are Customer Engagement Metrics?
Customer Engagement Metrics are key data that help businesses learn how customers connect with their brand and products. Keeping an eye on these metrics is very important for learning more about your target customers and increasing customer loyalty.
10 Customer Engagement Metrics You Should Track
1) Bounce Rate
Customers seek value, but if they don’t find it on your site, they’ll go to your competitors.
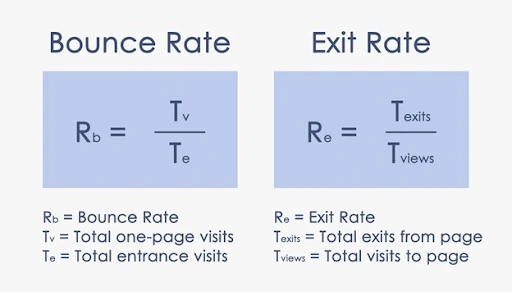
A high Bounce Rate can indicate several site issues like a bad user experience, slow page loading times, irrelevant content, and unengaging content. That is why you should aim to have a low bounce rate since the lower the bounce rate, the better it is for your business.
You can have a lower bounce rate by posting quality content on your website, posting appealing offers, and providing a great user experience.
The following formula is used to calculate the bounce rate:
2) Customer Satisfaction Score
In a CSAT survey, customers are asked how satisfied they are with their recent experiences. Among the possibilities can be a recent purchase, an interaction with a customer care agent, a live-chat conversation, etc. This can also be useful if you have recently changed a feature or altered a product and want to know how well your customers receive it.
Customers usually rate you from 1 to 5, with 1-2 being bad, 3 being okay, and 4-5 being good. It may be best to experiment with smiley faces or emojis if they fit your audience and brand voice. But at the same time, it’s essential to make sure the options are clear for your customers, so there is no confusion.
3) Conversion Rates
There are many ways in which your customers can interact with you besides simply using your product. Consider all the other touchpoints your audience can use to interact with you (such as signing up for your newsletter, purchasing an eBook, clicking on Facebook Ads, etc.) to monitor conversion rates.
You can find your Conversion Rate by dividing your Conversions by the total number of interactions. As a result, you’ll see how many people took the intended action compared to those who didn’t.
4) Churn Rate
Churn is a familiar concept to SaaS companies or subscription-based businesses. And keeping an eye on your churn rate is always a good idea. The churn rate reflects how many customers leave your service after a while.
Your top priority should be to reduce your churn rate to keep profitability and customer retention high. The more engaged your customers will be, the less energy (and budget) will be required to expend on attracting new ones.
5) Net Promoter Score
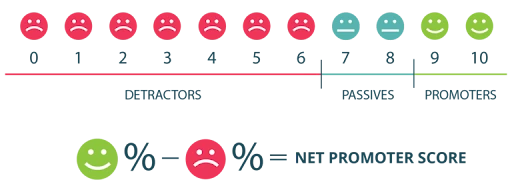
Net Promoter Score is a measure of customer loyalty or, more precisely, of how likely your customers will recommend your brand to their friends and family. You must understand this metric to understand how satisfied your customers are with your product.
Generally, NPS is measured by a customer survey. Most brands use sliding-scale numerical ratings for customers to rate their experiences.
Scores ranging from 0 to 6 are referred to as ‘detractors’, and it’s best to avoid having too many of these. Scores between 7 and 8 are considered ‘passives’, and they are not included in the calculation of your NPS score. Your scores of 9 and 10 are your ‘promoters’, individuals who are highly inclined to endorse you to others.
6) Customer Lifetime value
Customer Lifetime Value describes how much revenue a customer will generate for a company throughout their relationship. As opposed to customer retention, life cycle value discusses how much a customer spends with you during their lifetime.
Companies can use customer Lifetime Value to determine which customer groups are most valuable and ensure they are investing in profitably gaining new customers.
7) Customer Retention Rate
A high customer retention rate means a business is doing well at keeping customers happy and engaged. It shows that customers like the products or services and feel important to the company. This happens because customers keep coming back.
A low retention rate means customers are leaving, suggesting problems with the product, service, and customer experience. Customer churn can happen because of bad support, unfulfilled promises, or better deals from rivals. Understanding why customers leave is key for companies to keep them.
8) Average Session Duration
A longer average session time shows that users are very interested in the website, finding the information useful and related. This usually happens when the website is well-organized, has good content, easy-to-use navigation, and interactive features that make users want to stay longer.
If sessions are short, it could mean the website isn’t good enough or hard to use. Problems like slow pages, wrong content, or a hard-to-understand design can make users leave fast.
9) Pages Per Session
A high page-per-session rate means users enjoy the website’s content and want to visit more pages. This usually happens with Engaging content that connects with viewers, is an easy-to-use website, and has useful links within the site.
If users move through many pages, it means the website is engaging them well, which could result in more sales and happier customers.
A low page-per-session rate might mean the website isn’t engaging enough or that users can’t find what they’re looking for. Problems like bad design, confusing menus, or boring content can make users give up.
10) Ticket Volume
High ticket volume can mean customers are using a product or service a lot and asking for help, which is good. But, if the same problems keep coming up, it could be a sign of bigger issues. By diligently tracking ticket volume, companies can acquire important insights into customer behavior and satisfaction.
Conclusion
Interaction with customers is key to the achievement of any company. By tracking the right metrics, you can gain deeper insights into your customer’s needs preferences, and behavior. This allows you to refine your approach, build stronger relationships and ultimately drive higher customer satisfaction and loyalty. By reminding these key metrics you can engage your audience effectively and grow your business.
CRM Masters Infotech is a CRM Service Provider company and dedicated to improving customer engagement and increasing revenue growth. Our team offers a comprehensive range of services, including custom CRM solutions, seamless integrations, and migration support.
Get in touch with us today for expert guidance!
