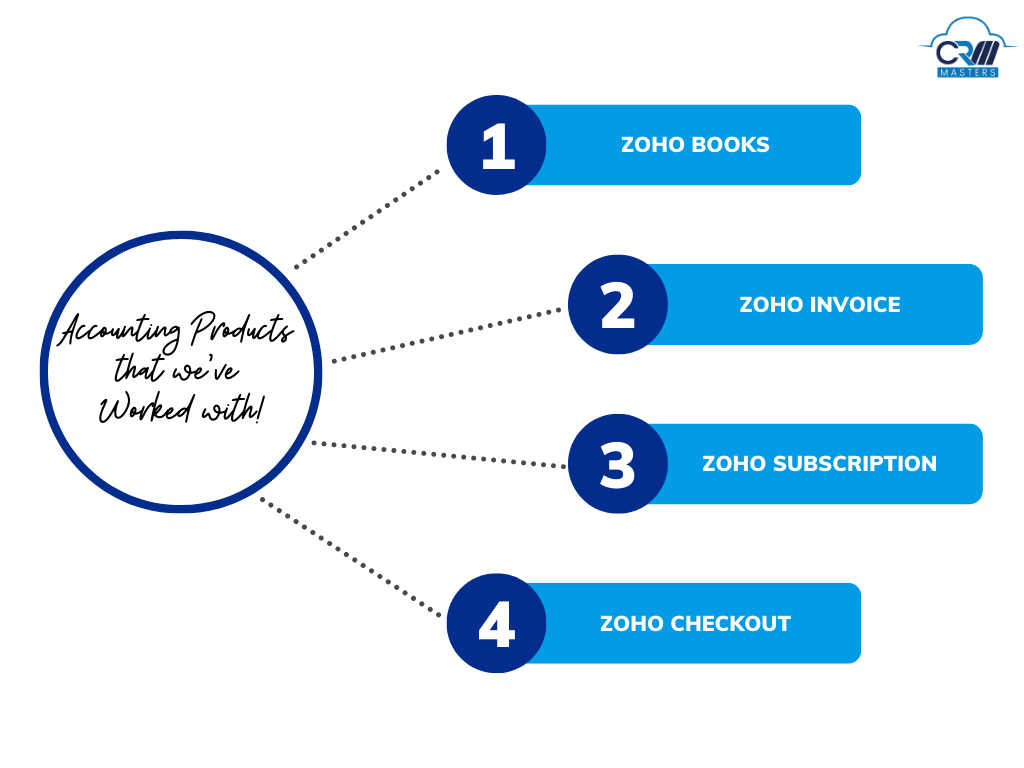
Zoho Books
It is cloud-based accounting software that helps businesses manage finances, automate workflows, and work cross-functionally. While enterprise-level companies use the bulk of Zoho’s products, Zoho Books is designed for smaller and mid-sized businesses.
Zoho Invoice
This 100% free cloud-based tool helps small businesses create invoices, track expenses, and accept payments online. The key features are project billing, time tracking, reporting, customizable templates, and a client portal.
It allows teams to track estimations, convert them to invoices, and remind clients to pay on time. Aside from that, users can create tasks, collect advance payments for projects, and track their invoice history.
Users can choose from a wide variety of premade invoice templates while being able to customize these templates to add their business’s individual touch. The app supports multiple languages and currencies, making it an excellent choice for users worldwide.
Zoho Subscriptions
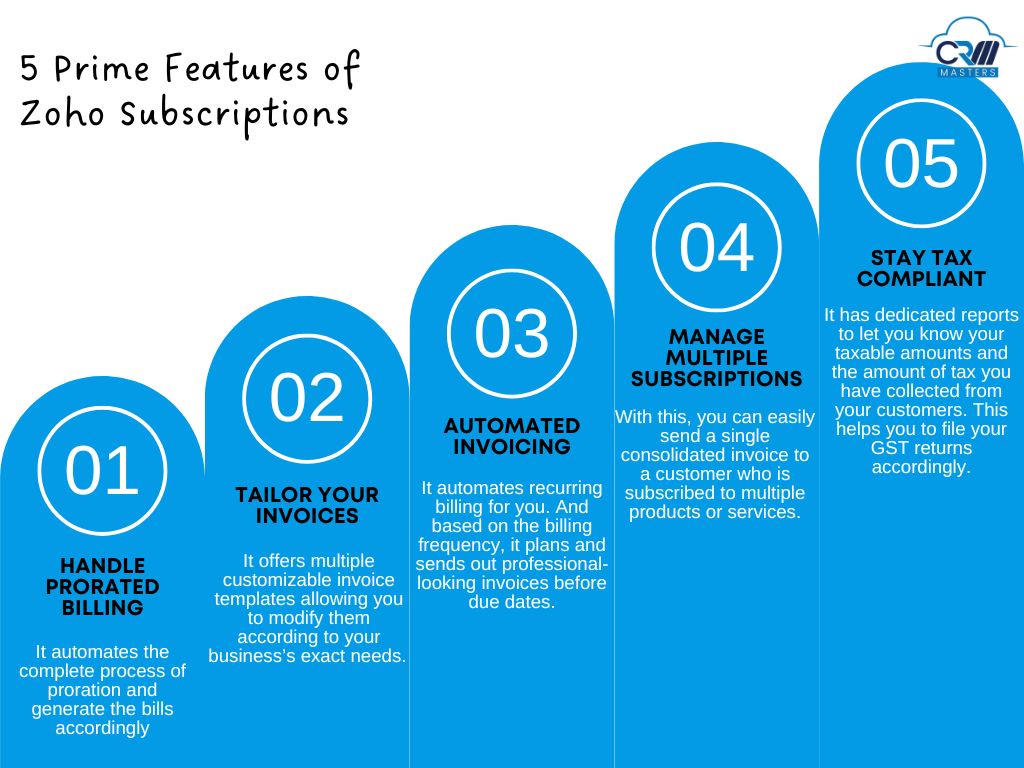
Designed for growing businesses, Zoho Subscriptions manages the entire subscription lifecycle for customers. Its best feature is that it is pre-integrated with Zoho’s Accounting Software(Books) to make it compatible with Zoho Subscriptions. As a result, any transactions related to new subscriptions, renewals, customer credit, refunds, etc., will be automatically logged in to Zoho Books, saving users time and effort.
Zoho Checkout
The Zoho Checkout Application allows you to collect recurring and offline payments through custom-branded payment pages without having coding knowledge. You can customize invoices with specific terms and conditions and share them with your clients. Further, payment pages can be shared via social media and email or embedded buttons to redirect payers to payment pages embedded on the industry website. The software also handles refunds. Key features include Branded Pages, Hosted Payment Pages, Multiple Billing Intervals, Easy Payment Tracking, Managing Automatic Retries, Integrated Payment Gateways, Zoho Campaigns, MailChimp, and Zoho Books Integration.


